docker-persist-share-data
docker-frequently-used-commands
docker-image-container-on-disk
Image and Container Concept
The major difference between a container(runtime) and an image(static) is the top writable layer. All writes to the container that add new or modify existing data are stored in this writable layer. When the container is deleted, the writable layer is also deleted. The underlying image layers remain unchanged.
Because each container has its own writable container layer, and all changes are stored in this container layer, multiple containers can share access to the same underlying image and yet have their own data state.

docker-storage-driver
docker-core-tech-aufs
AUFS
Introduction
- advanced multi layered unification filesystemAufs is a stackable unification filesystem such as Union fs which unifies several directories and provides a merged single directory.
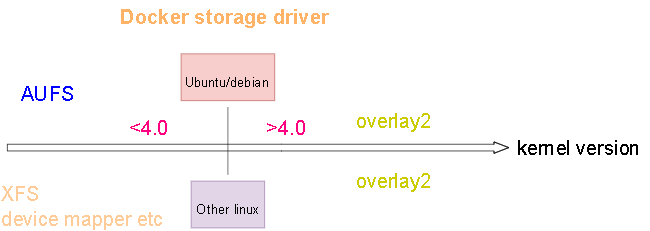
- overlay2 is the preferred storage driver, for all currently supported Linux distributions, and requires no extra configuration.
- aufs was the preferred storage driver for Docker 18.06 and older, when running on Ubuntu 14.04 on kernel 3.13 which had no support for overlay2
AUFS is not merged into linux main branch, only ubuntu/debian support it!!!
docker-core-tech-chroot
Chroot
Introduction
Every process/command in Linux/Unix like systems has a current working directory called root directory. chroot changes the root directory for current running process as well as its children.
it creates a virtualized environment in a Unix(linux) operating system, separating it from the main operating system’s directory structure. This process essentially generates a confined space with its own root directory, to run software programs. This virtual environment runs separately from the main operating system's root directory.
Any software program run in this environment can only access files within its own directory tree. It cannot access files outside of that directory tree. This confined virtual environment is often called a "chroot jail".
debugging application
performance tools
Performance knowledge
Memory Usage Metric
1 | Show process memory usage by top |
load average
The load average is the average system load on a Linux server for a defined period of time. In other words, it is the CPU demand of a server that includes sum of the running and the waiting threads. on linux, it not only tracks running tasks, but also tasks in uninterruptible sleep (usually waiting for IO)
Measuring the load average is critical to understanding how your servers are performing; if overloaded, you need to kill or optimize the processes consuming high amounts of resources, or provide more resources to balance the workload.
For simple, let's assume a server with a single processor, if the load is less than 1, that means on average, every process that needed the CPU could use it immediately without being blocked. Conversely, if the load is greater than 1, that means on average, there were processes ready to run, but could not due to CPUs being unavailable.
For a single processor, ideal load average is 1.00, and anything above that is an action call to troubleshoot? Well, although it’s a safe bet, a more proactive approach is leaving some extra headroom to manage unexpected loads, many people tend to aim for a load number of about 0.7 to cater for the spikes
overloaded or not depends on how may cpus(not core) you have
You probably have a system with multiple CPUs. The load average numbers work a bit differently on such a system. For example, if you have a load average of 2 on a single-CPU system, this means your system was overloaded by 100 percent — the entire period of time, one process was using the CPU while one other process was waiting. On a system with two CPUs, this would be complete usage — two different processes were using two different CPUs the entire time. On a system with four CPUs, this would be half usage — two processes were using two CPUs, while two CPUs were sitting idle.
