linux-performance-systemtap
Introduction
SystemTap provides the infrastructure to monitor the running Linux kernel and application for detailed analysis. This can assist administrators and developers in identifying the underlying cause of a bug or performance problem. SystemTap is designed to eliminate this and allows users to gather the kernel information by running user-written SystemTap scripts., you do NOT need to write kernel module, compile it and load it by yourself, you just write systemtap script, then systemtap framework does all other things for you(which actually use kprobe)
For short, add hooks at point event(function enter, function return etc) for running application or kernel, in hooks print or check something.
How it works
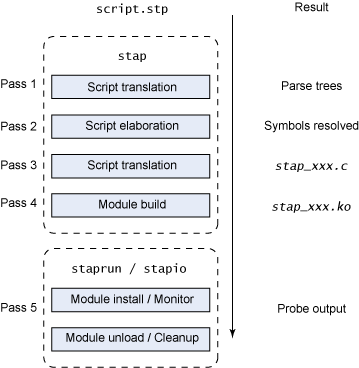
- First, SystemTap checks the script against the existing tapset library (normally in /usr/share/systemtap/tapset/ for any tapsets used. SystemTap will then substitute any located tapsets with their corresponding definitions in the tapset library.
- SystemTap then translates the script to C, running the system C compiler to create a kernel module from it. The tools(
stap) that perform this step are contained in the systemtap package - SystemTap loads the module, then enables all the probes (events and handlers) in the script. The
staprunin the systemtap-runtime package provides this functionality. - As the events occur, their corresponding handlers are executed.
- Once the SystemTap session is terminated, the probes are disabled, and the kernel module is unloaded.

Setup to use systemtap
1 | $ yum install systemtap systemtap-runtime |
Probe
Probe = event + its handler
The essential idea behind a SystemTap script is to name events, and to give them handlers. When SystemTap runs the script, SystemTap monitors for the event; once the event occurs, the Linux kernel then runs the handler as a quick sub-routine, then resumes.
There are several kind of events: entering/exiting a function, timer expiration, session termination, etc. A handler is a series of script language statements that specify the work to be done whenever the event occurs. This work normally includes extracting data from the event context, storing them into internal variables, and printing results.
FORMATprobe PROBEPOINT [, PROBEPOINT] { [STMT ...] }
PROBEPOINT supports wildcard match
alias
New probe points may be defined using aliases. A probe point alias looks similar to probe definitions, but instead of activating a probe at the given point, it defines a new probe point name as an alias to an existing one. New probe aliases may refer to one or more existing probe aliases. Multiple aliases may share the same underlying probe points
FORMATprobe <alias> = <probepoint> { <prologue_stmts> }
1 | probe socket.sendmsg = kernel.function ("sock_sendmsg") { ... } |
===
1 | probe kernel.function("sock_sendmsg") {...} |
function
SystemTap scripts may define subroutines to factor out common work. Functions may take any number of scalar arguments, and must return a single scalar value. Scalars in this context are integers or strings. For more information on scalars.
FORMAT
1 | function <name>[:<type>] ( <arg1>[:<type>], ... ) { <stmts> } |
Kernel Probe
ProbePoint
1 | # these two are actually alias!! |
Probe examples
1 | probe kernel.function("sys_mkdir").call { log ("enter") } |
NOTEKernel has prebuilt probe markers This family of probe points connects to static probe markers inserted into the kernel or a module. These markers are special macro calls in the kernel that make probing faster and more reliable than with DWARF-based probes. DWARF debugging information is not required to use probe markers.
User Probe
ProbePoint
1 | # PATH can be binary or library!!! |
Probe examples
1 | probe process("/usr/lib64/libvirt/connection-driver/libvirt_driver_qemu.so").function("qemuMonitorSend") {} |
static probing
You can probe symbolic static instrumentation compiled into programs and shared libraries with the following syntax:process("PATH").mark("LABEL")
Use STAP_PROBE1 for probes with one argument. Use STAP_PROBE2 for probes with 2 arguments, and so on. The arguments of the probe are available in the context variables $arg1, $arg2, and so on.
As an alternative to the STAP_PROBE macros, you can use the dtrace script to create custom macros. The sdt.h file also provides dtrace compatible markers through DTRACE_PROBE and an associated python dtrace script.
NOTE: static probing can probe at any point as it's programed by user, hence you can pass any args to it, like local var etc, but dynamic probling can only probe and enter and exit of a function
tapset
Tapset scripts are libraries of probe aliases and auxiliary functions, refer to tapset function
location: /usr/share/systemtap/tapset/
Frequently used
1 | tid() The id of the current thread. |
Example of User application with systemtap
systemtap script has similarity with C language, refer to script syntax, flow control, array
if you want to use systemtap for user application, make sure application is built with symbol(-g) or install symbol separately when dtrace is not compiled in
dtrace disable
You must have the symbol table to find the function used in stp.
test.c
1 |
|
test.stp
1 | probe process("./test").begin { |
1 | $ stap test.stp |
dtrace enabled
No need to build with debug info if only use marker as dtrace stores the address of marker when compiling the code, but if you want to use function name, symbol table is required as well.
test.c with markder(dtrace probe)
1 |
|
test.stp
1 | probe process("./test").begin { |
1 | $ stap test.stp |